Repository Analytics & Coverage
Hawzu provides built-in Analytics and Coverage views to help you understand the overall health of your test repository. These views surface key insights that help teams identify gaps, track progress, and make informed testing decisions.
Repository Analytics
Repository Analytics give you a high-level view of how test cases are organized and maintained within a project.
Accessing Analytics
To view analytics:
- Open the Repository inside a project
- Click Analytics in the repository header
- An analytics overview panel opens
Analytics are calculated based on:
- The entire repository, or
- The currently selected folder
What Analytics Show
The analytics view provides a snapshot of your repository, including:
- Total number of test cases
- Total number of folders
- Split between manual and automated test cases
- Distribution of test cases across priority, severity, and test type
- Automation status overview
- Most commonly used tags
- Recent activity such as newly created test cases
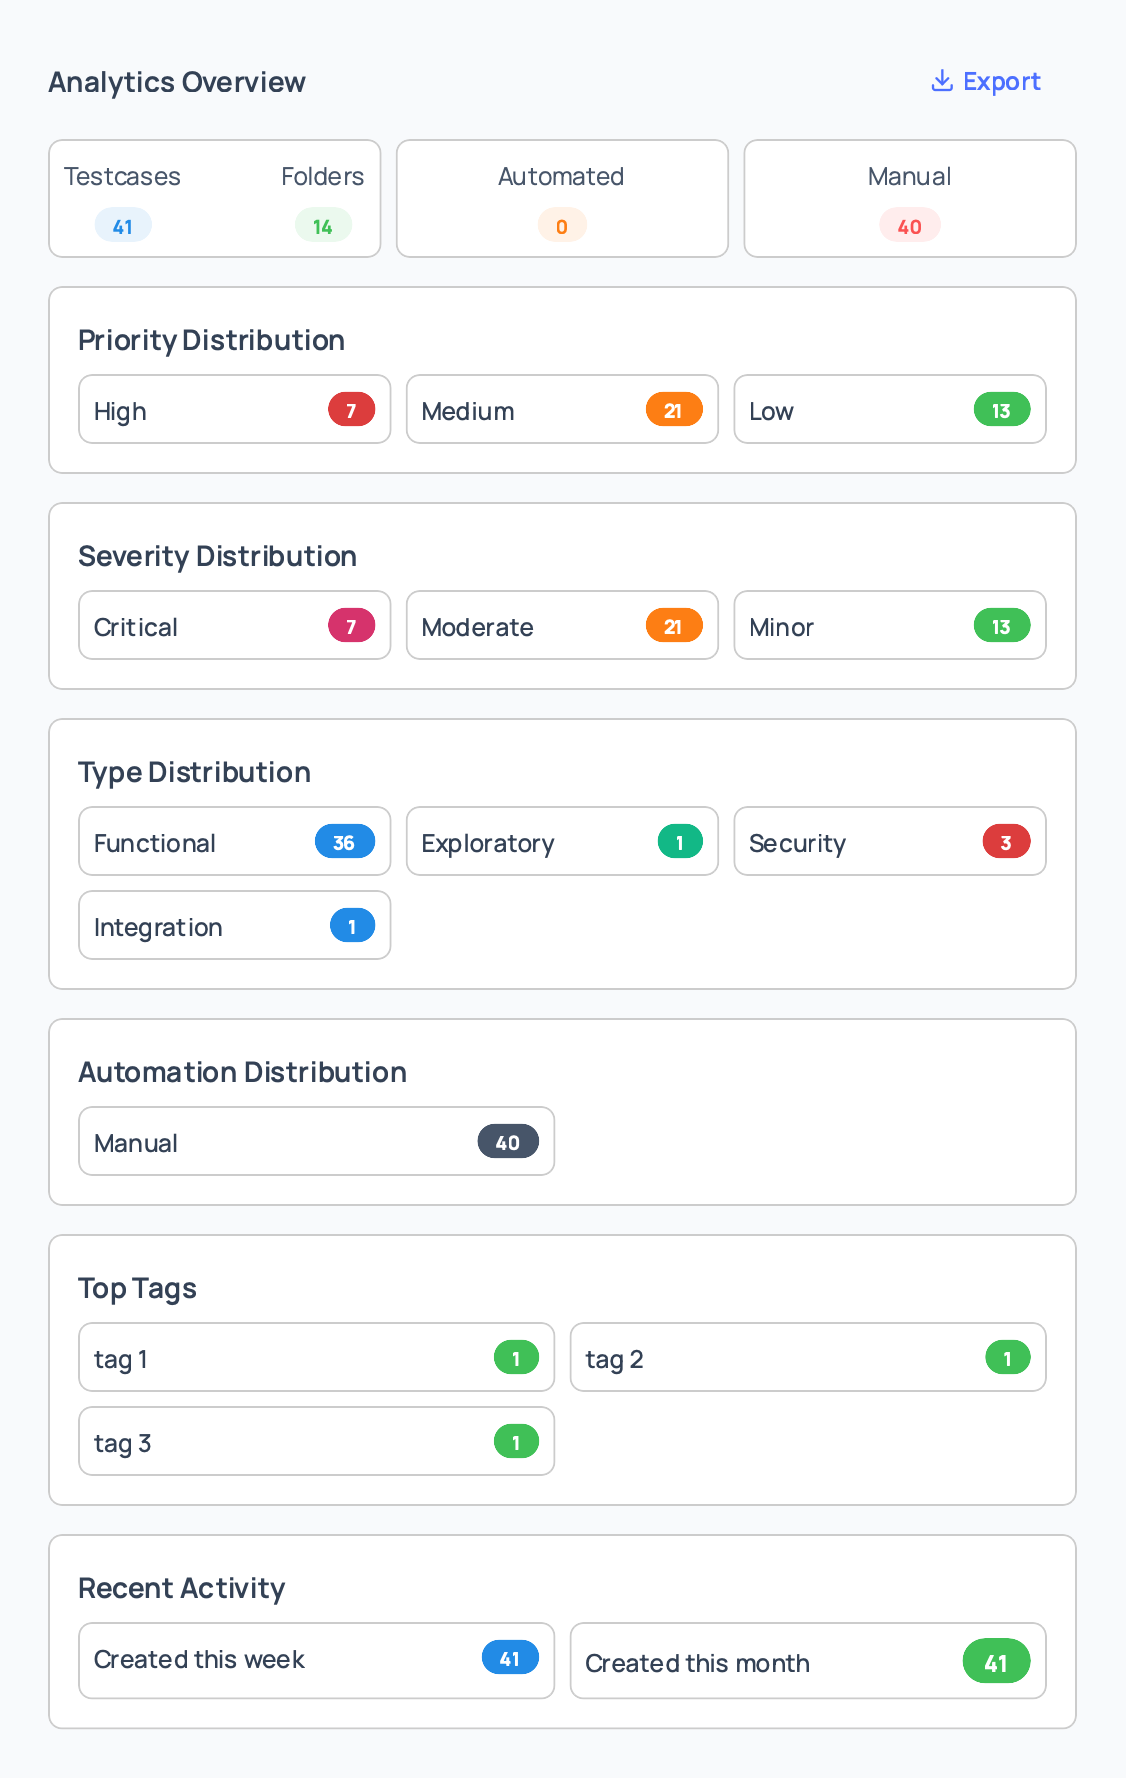
These insights help teams understand how test cases are structured and where effort is concentrated.
Exporting Analytics
Analytics data can be exported for reporting and analysis.
Common use cases include:
- Sharing status updates with stakeholders
- Audits and reviews
- Offline analysis and documentation
Test Coverage
Coverage focuses on requirement traceability and shows how well requirements are validated by test cases.
Accessing Coverage
To view coverage:
- Open the Repository
- Click Coverage in the repository header
- The coverage overview panel opens
Coverage is calculated for:
- The entire repository, or
- The selected folder
What Coverage Shows
The coverage view provides:
- Overall coverage percentage
- Number of requirements covered by test cases
- Total number of requirements in the project
- Coverage distribution across different requirement attributes
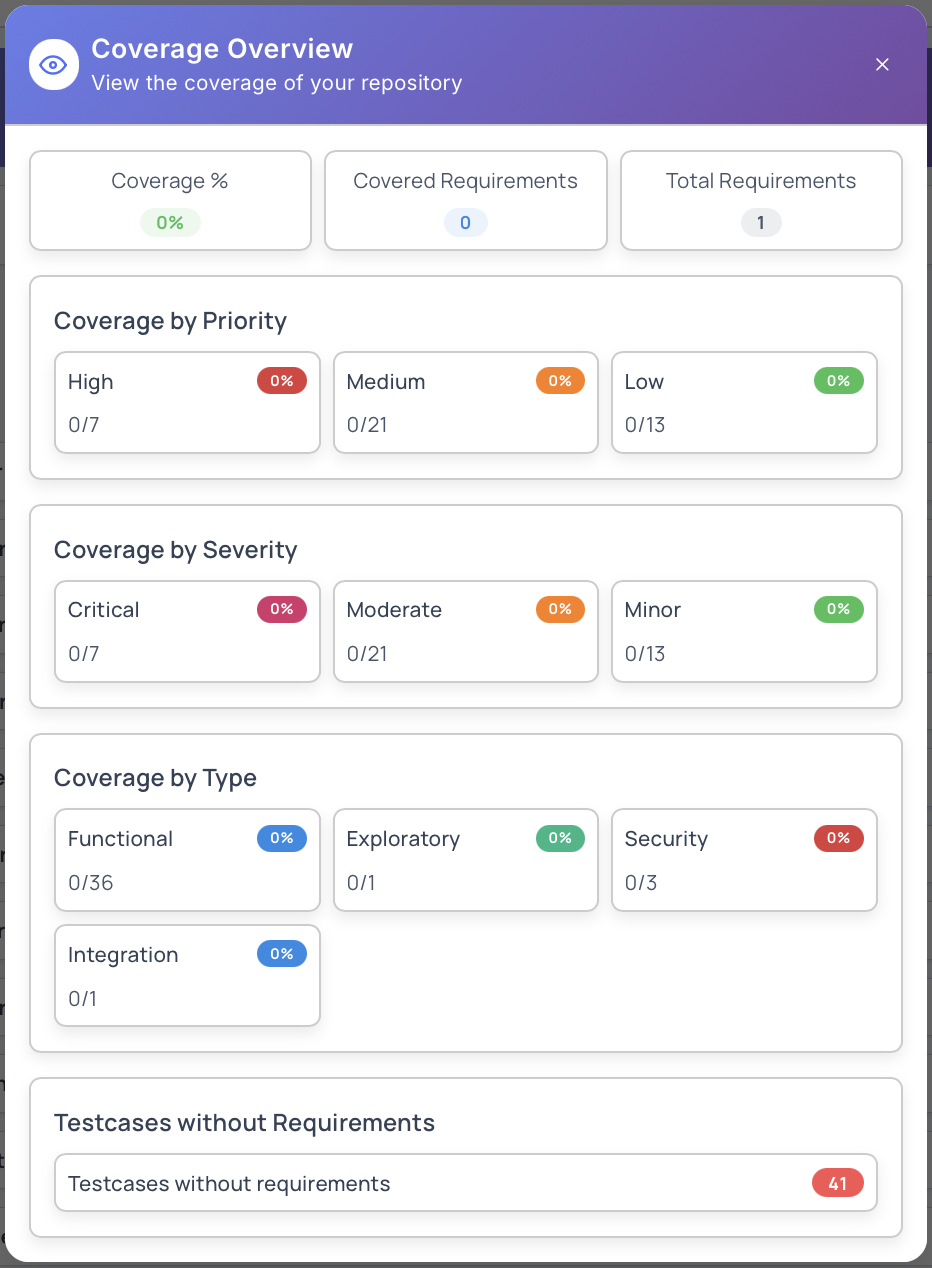
This makes it easy to understand how thoroughly requirements are tested and where gaps exist.
Using Coverage Effectively
Coverage insights help teams:
- Identify requirements without test coverage
- Prioritize test case creation for critical areas
- Track testing completeness before releases
- Communicate testing readiness clearly
Best Practices
- Review analytics regularly to keep the repository healthy
- Use distribution insights to balance priority and severity coverage
- Track automation progress over time
- Monitor coverage before major releases
- Ensure test cases are consistently linked to requirements
Permissions
Access to analytics and coverage depends on project role:
- Project Manager – Full access
- Project Coordinator – Full access
- Project Member – View access
- Project Viewer – Read-only access
Analytics and coverage respect folder-level access permissions.
Next Steps
- Explore Repository Overview
- Learn about Create Test Cases
- Read about Bulk Operations
- Understand Requirements Management